Updated Walgreens Data covid testing data from the last week of April 2022
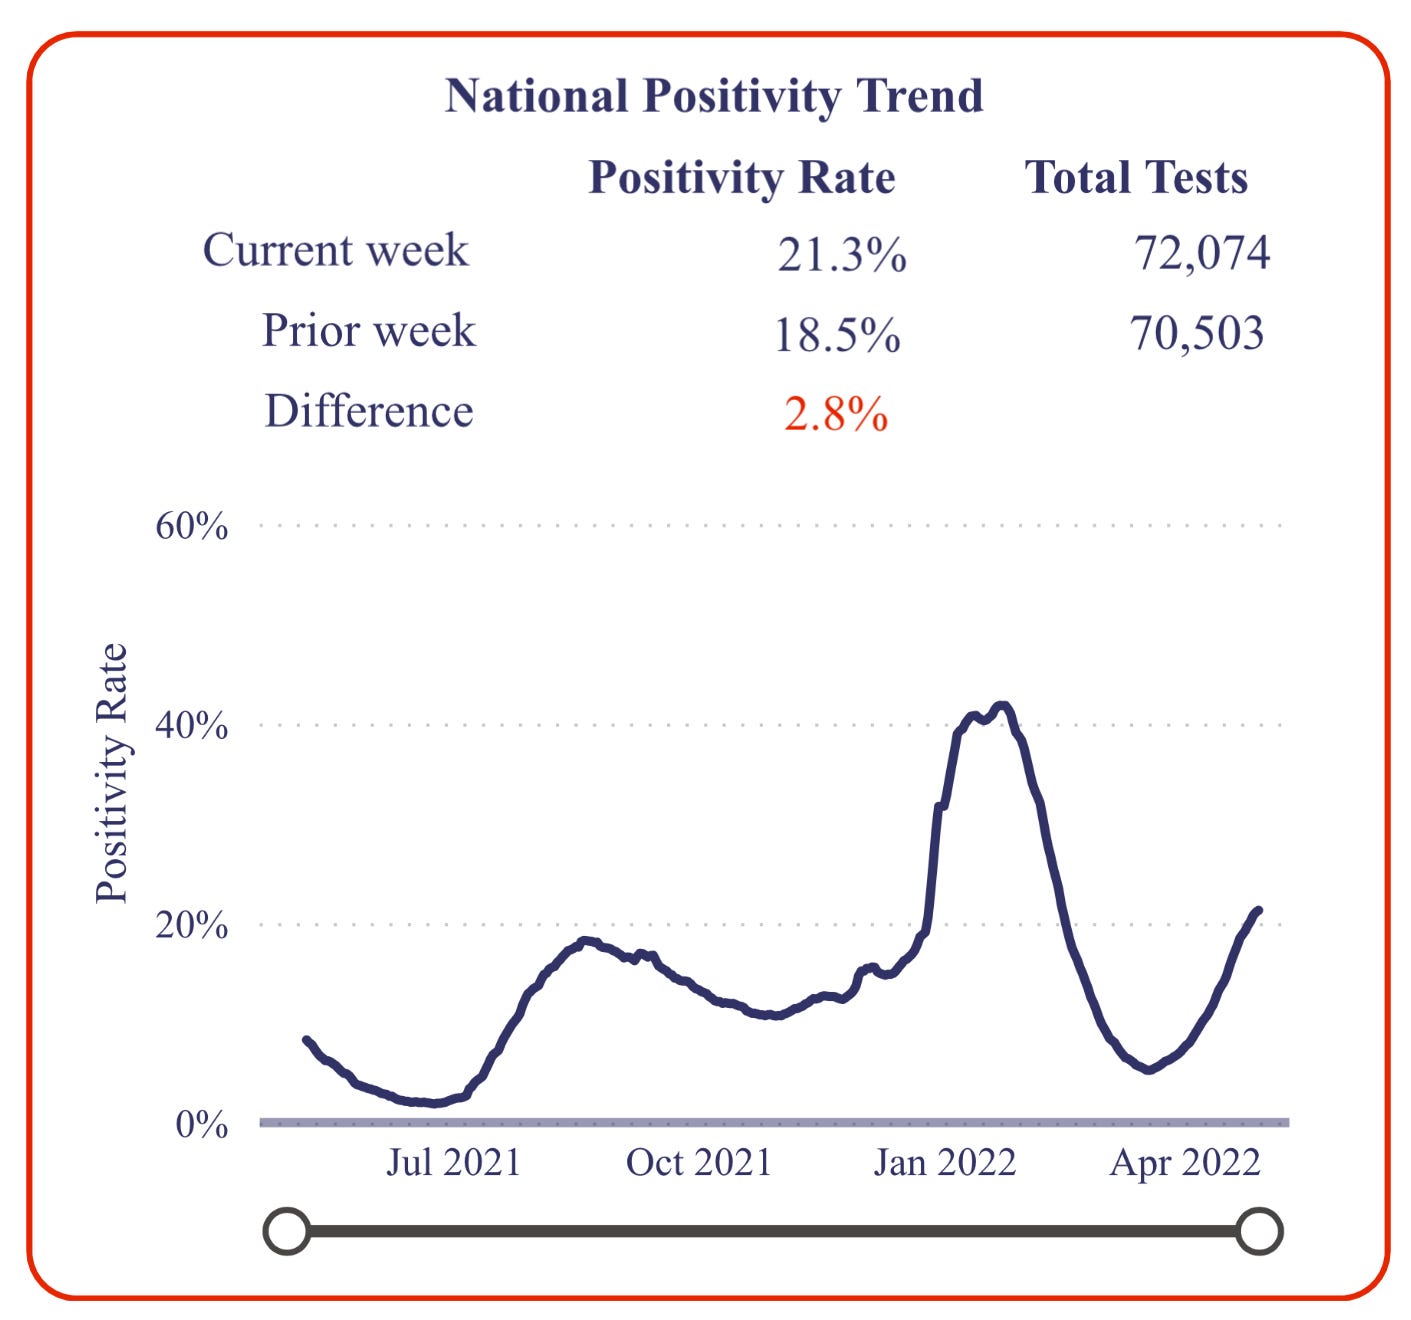
I find this site to be fascinating, so I am watching the weekly statistics as they evolve. Lo and behold…….the last week of April had a massive increase in some testing data statistics.
First things.
Here is the weekly test numbers. 72,074 people tested the week of April 22-29.
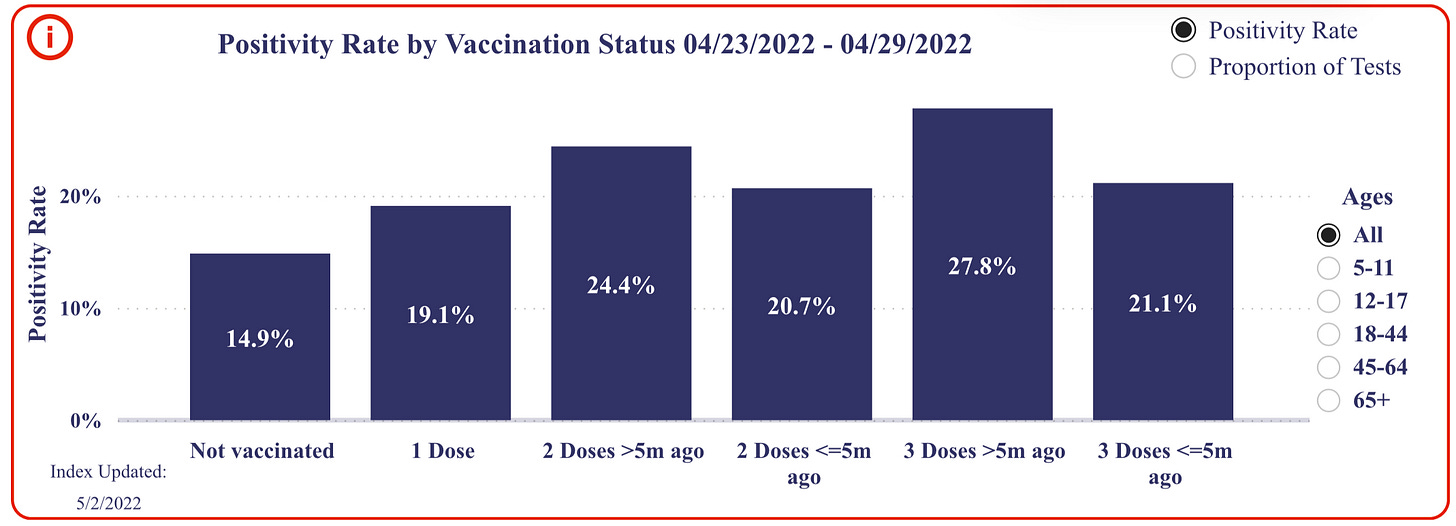
Next up: the positive covid test percentages for all ages:
14.6% of positive covid tests were among the unvaccinated group
48.9% of positive tests were among the TRIPLE VACCINATED GROUPS
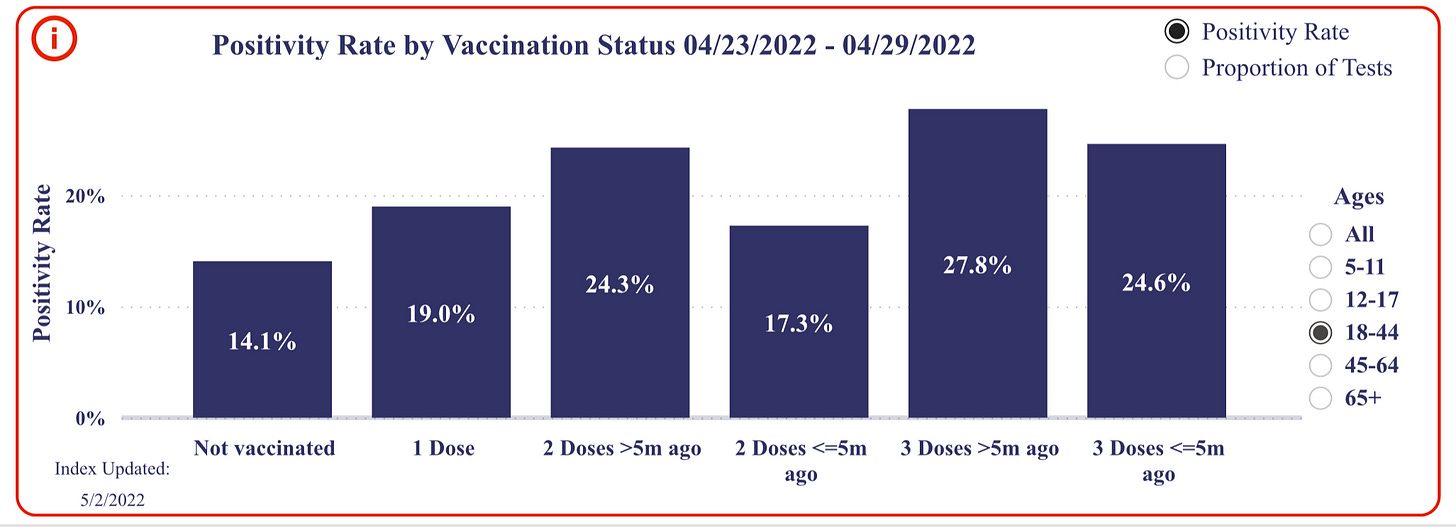
But WOWSERS……look at the positivity rates in age 18-44!!!
14.1% positive tests among unvaccinated
52.4% of positives were among the TRIPLE VACCINATED!!!!!!
The unvaccinated still remain the largest tested group yet the LOWEST positivity rate.
So to recap, compared to the data 2 weeks previous, the unvaccinated positivity rate went up 4.5%, while the triple vaccinated went up 12% among all age groups, and it went up 10% among the triple vaccinated age 18-44.
Folks, this is NOT the trend you want to see if we want a guarantee that the covid vaccine is doing its job at preventing illness. The first two vaccines and boosters have done nothing to prevent illness. Remember…….the largest percentage of testing is done on UNVACCINATED PEOPLE of all ages, primarily the working age 18-65. Yet they have the lowest rate of covid positive tests.


In South Australia the only state that still counts V status of hospitalised, the 3x lot are about 60% of the population yet they have hovered around 70% of the admissions for months. Unfortunately CovidLive does not differentiate the unV'd from the 1s & 2s, who are 95% injected, and that sits at around 25%.
Where does it show unvaccinated are the most tested? Just for all the covidiots who will rebuttal with that