What led to a 6-fold increase in heart attack deaths in Mumbai in early 2021?
https://indianexpress.com/article/explained/mumbai-heart-attack-rise-explained-7984371/
In the period between January-June 2021, nearly 3,000 people lost their lives to heart attacks every month which was around 500 in 2020.
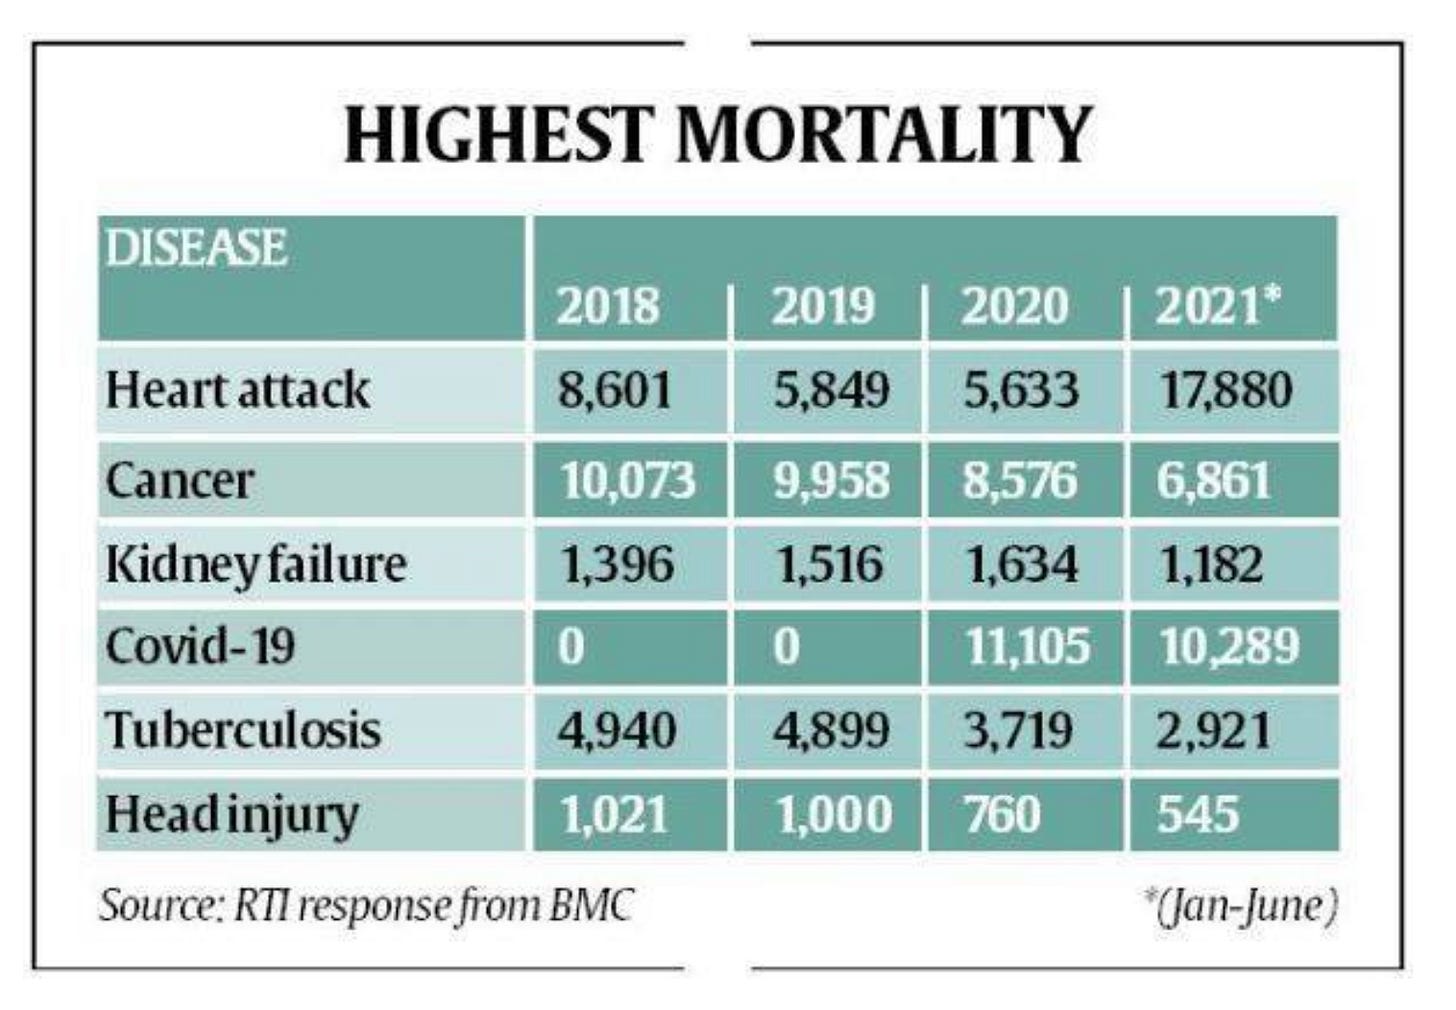
Nearly 23.8 per cent (17,880) of the total 75,165 deaths recorded till June last year in Mumbai were attributed to heart attacks. This information was revealed through an RTI filed by an activist Chetan Kothari.
The figures have raised several questions about the sudden, unprecedented surge in deaths related to heart attacks. Medical officials have attributed several factors behind the staggering spike – post-Covid development of thrombosis, delay in diagnosis in heart-related ailment amid the second wave, better recording of heart-attack cases, major lifestyle changes and additional distress noticed in the second wave. But here is the problem with that hypothesis: these conditions would have presented in 2020. If covid was to blame, why did we not see increases in the months after covid started? Better recording of heart attack cases? Give me a break. Those are a standard death certificate notation, in fact, one of the most common causes of death given. If this was due to the virus, then why did these heart attack deaths rise by 500 per month only AFTER the covid vaccine was introduced?
Lets look at the historical data. Data provided by the Brihanmumbai Municipal Corporation (BMC) showed that in 2019, a total of 5,849 patients lost their lives to heart attack in Mumbai. This dropped slightly by 3.6 per cent when in 2020, 5,633 patients succumbed to the disease. But, to everyone’s surprise, in the the period between Jan-June 2021, a total of 17,880 succumbed to heart attacks in Mumbai with a surge of 217 per cent, compared to the previous year, as per the RTI. We lost 3x more people in SIX MONTHS ALONE in 2021 versus the two previous years. IF it was the virus, we would have seen an increase starting in 2020, not a DECLINE. Below is a graph from 2018-2021 where 2021 was just a 6 month representation, all other years were the entire 12 months. **note those cancer death rates in just 6 months alone in 2021 as well…….along with kidney failure……in addition to the astronomical rise in heart attacks.
If we just assume for argument sake that the first half of 2021 copied itself in terms of numbers for the second half of 2021, it would look like this:
35,000 heart attacks
13,000 cancer deaths
2250 kidney failure
20,400 covid deaths
5900 tuberculosis deaths
1100 head injury deaths
Again,these are just assumptions and I have no data to back this up. This is just for potential and argument sake. After the introduction of the covid vaccine in December 2020, when you compare the possible totality of 2021, look how exponentially increased ALL deaths are compared to 2018-2020.
Stinks, doesn’t it. They do all they can to blame EVERYTHING ELSE except for, you know, the “thing” they injected into people.

