The influenza fear porn is in overdrive……but the CDC data does not match what the mainstream media is reporting.
First we begin with this. https://news.yahoo.com/flu-season-hit-13-record-154222684.html
Published on Yahoo news from The Independent on 10-28-22. “Flu Season has hit a 13 year record so far, comparable to the 2009 H1N1 Swine Flu outbreak”. Per the article:
“The flu is hitting the US hard, with 880,000 cases of lab-confirmed influenza illness, 6,900 hospitalisations, and 360 flu-related deaths recorded in the nation this year.
According to the US Centres for Disease Control and Prevention, the last year there was a comparable flu "burden" was 2009 during the H1N1 swine flu pandemic. The flu burden is a metric used by the CDC to determine the severity of the flu.
“It’s unusual, but we’re coming out of an unusual covid pandemic that has really affected influenza and other respiratory viruses that are circulating,”Lynnette Brammer, an epidemiologist who heads the CDC’s domestic influenza surveillance team, told The Washington Post. The extent of the extant infections is unusual considering the flu season generally begins in October.”
OK OK OK……this is not truthful reporting OR information.
#1. Flu seasons are October-March on average. They generally peak sometime in December-January, sometimes have a second peak in late January/early February.
#2. Flu season CDC reporting starts over EVERY year at week 40 of the year. Because that is October when flu season starts. So what numbers are this article using??? All of 2022 dating back to January? Or the definition of flu season which always restarts at week 40?? Here is where their numbers DO NOT ADD UP.
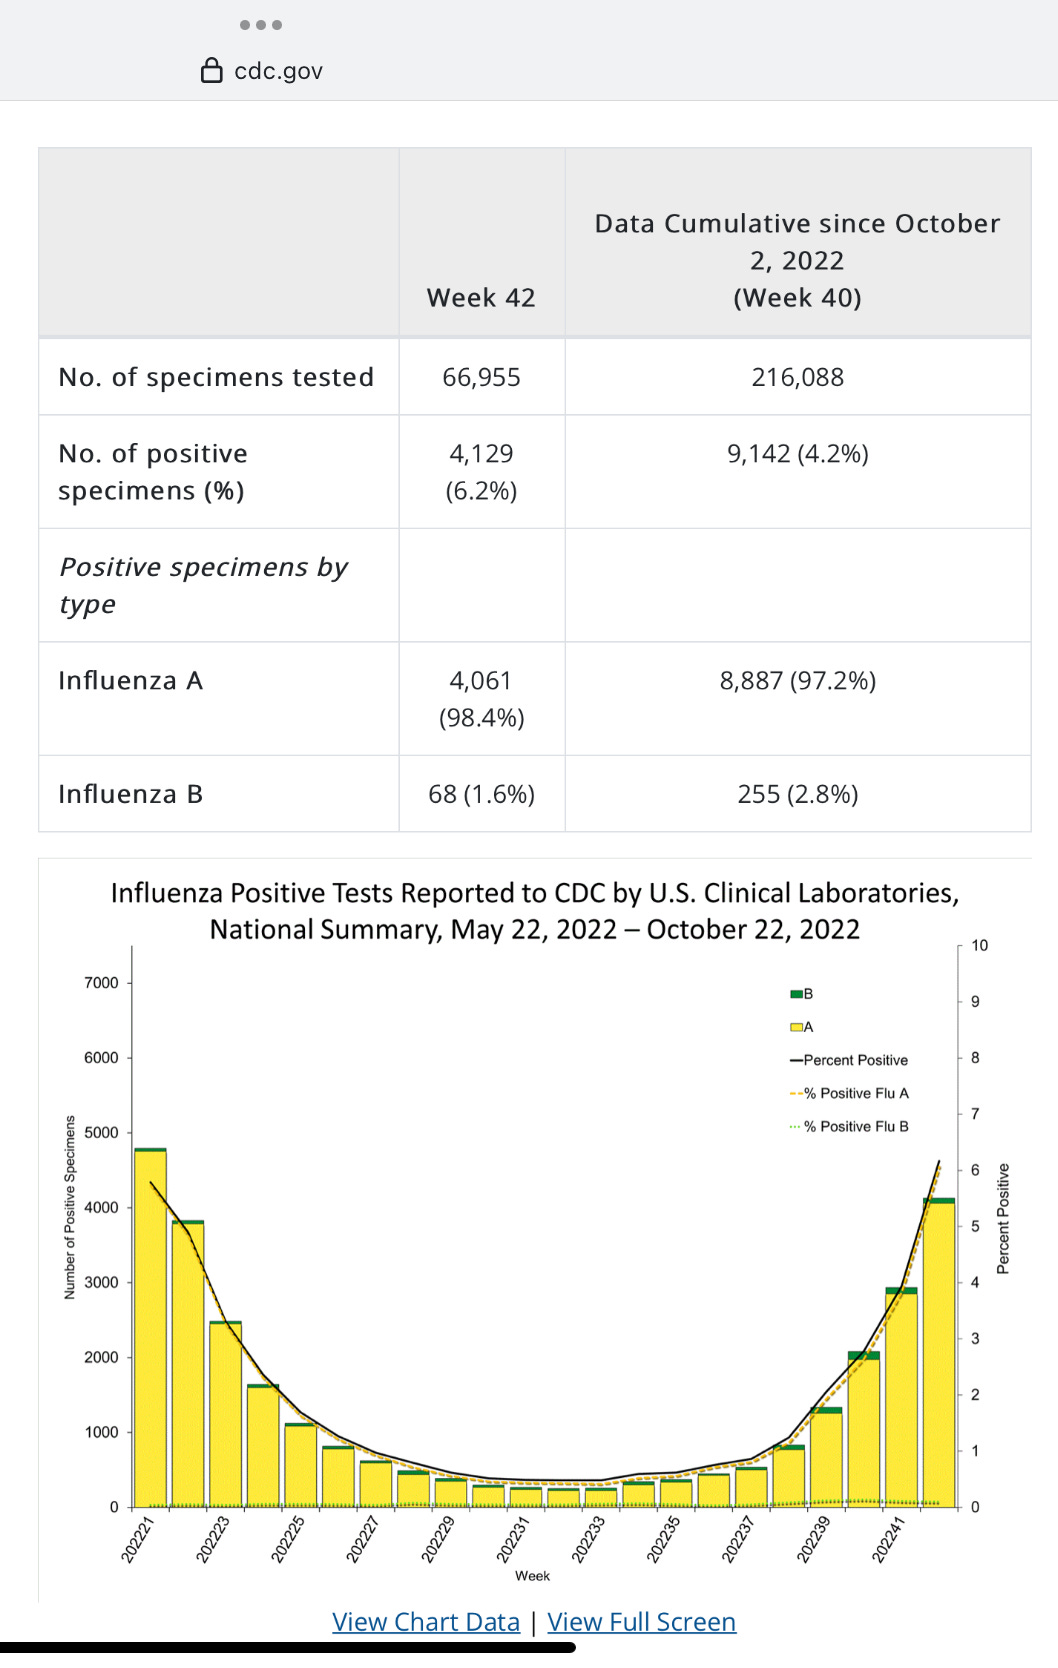
Exhibit A: the current flu season numbers (starting at week 40 for 2022) courtesy of the CDC:
My math says that this current flu season is sitting at 8,887 flu A cases and 255 flu B cases for a total of 9,142 flu cases.. We flu tested 216,088 people for a positivity rate of 4.2%. When you tally up the appx 330 million people in our country, the flu positivity rate through week 42 is a whopping 0.028%. Here is where this data comes from: https://www.cdc.gov/flu/weekly/index.htm
So by standard definition of “current flu season per the CDC”, we are NOWHERE near this bloated inflated headline grabber numbers.
To further validate that this is how we track flu seasons, this is a screen shot from 10-29-22 FROM the CDC that clearly shows we “reset” the flu count stats on week 40.
So I have to hypothesize that they are using flu data from ALL of 2022……which by the way has never been done before in history. We only look at week 40 to week 40 data. That is the reset of the new flu season reporting. So I went backwards in the CDC data to look at the ENTIRE year of 2022.
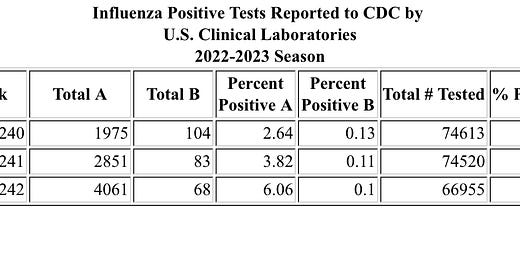
Exhibit B: The table above actually tracked flu season data from MAY 2022 thru present. Those weekly numbers do not add up to the 880,000 flu cases this year either, even stepping OUT of the traditional CDC definition of what we count as a flu season being week 40 to week 40 the following year.
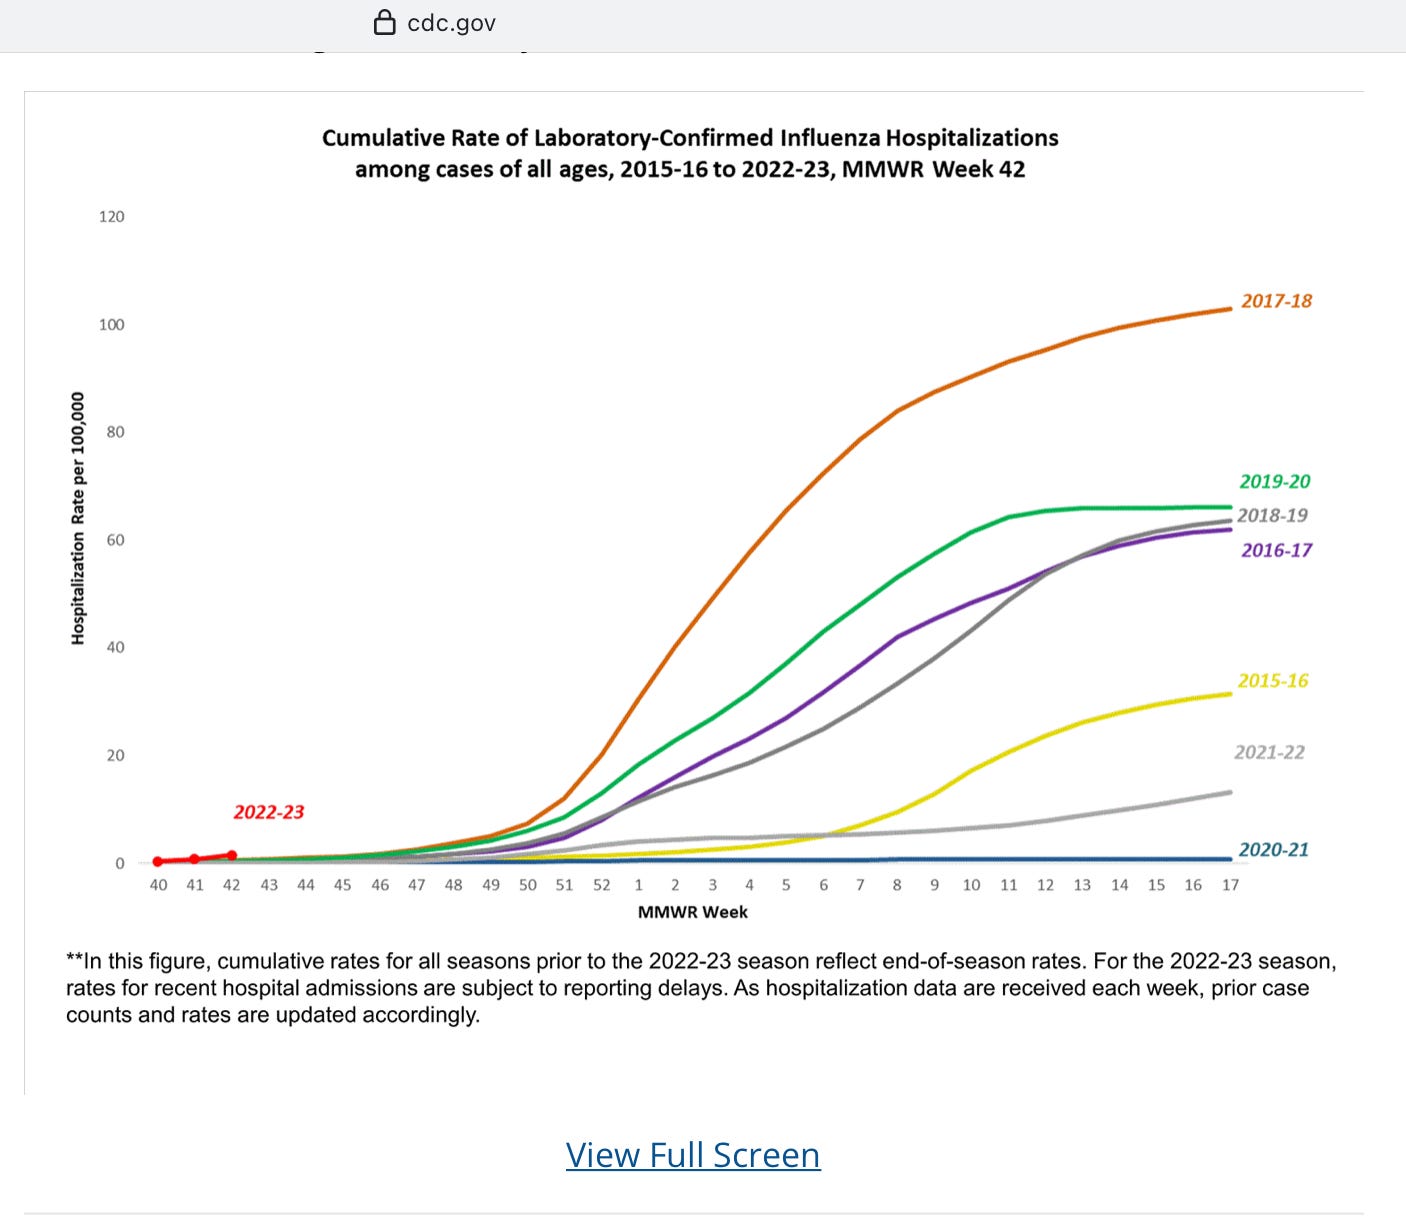
We also have the hospitalization data:
So the article states 6900 hospitalizations. Well, we know that cannot be based on week 40 2022 to present because the red-line data point above is for the new flu season that began week 40 2022. There are not 6900 hospitalizations there whatsoever. So lets even go back to 2021-2022 (the gray line). Aside from 2020-2021, the year the flu skipped over us like a naughty kid on Santa’s list, where did hospitalizations from influenza come in at? The SECOND LOWEST HOSPITALIZATION total. Excess hospitalizations? Um, where?? The data does not support that whatsoever. Lets say that 2021-2022 had 10 hospitalizations per 100,000 people. That gray line is sitting at appx 10. Well that total does not equal 6900 either!!! That is closer to the 30,000 range for the entire 2021-2022 flu season that ended on week 40 of 2022.
Exhibit C: “flu seasons unlike anything we have seen since 2009 swine flu”. Ok, where on any of these data maps is that supported??? It isn’t. The flu data above for hospitalizations does not support that statement at all.
Then there is this little gem. They want you to think this graph is FLU data. It is not. It is visits to urgent care/PCP/ER etc for “upper respiratory illness” or “influenza like illness”. These are not flu cases diagnosed. What I find most interesting here is look at the pink line. It just ended 3 weeks ago and is below baseline. But we suddenly jumped at the start of new flu season week 40…..the current flu year is always red triangles. So more and more people are going to see primary care for respiratory issues. Not necessarily flu. This ignores covid completely so that data won’t be found on fluview.
I will throw out another hypothesis here. Because most of you will remember the earlier post I made that the flu is going to be the fear monger event of the season. Many many many things will be called “influenza” this winter. That junk article by the Independent is setting up the public to accept that hundreds of thousands of people will be sick this winter. Most likely due to having no immune system to fight off even a basic cold. I will do periodic CDC influenza checks and posts over the winter months.
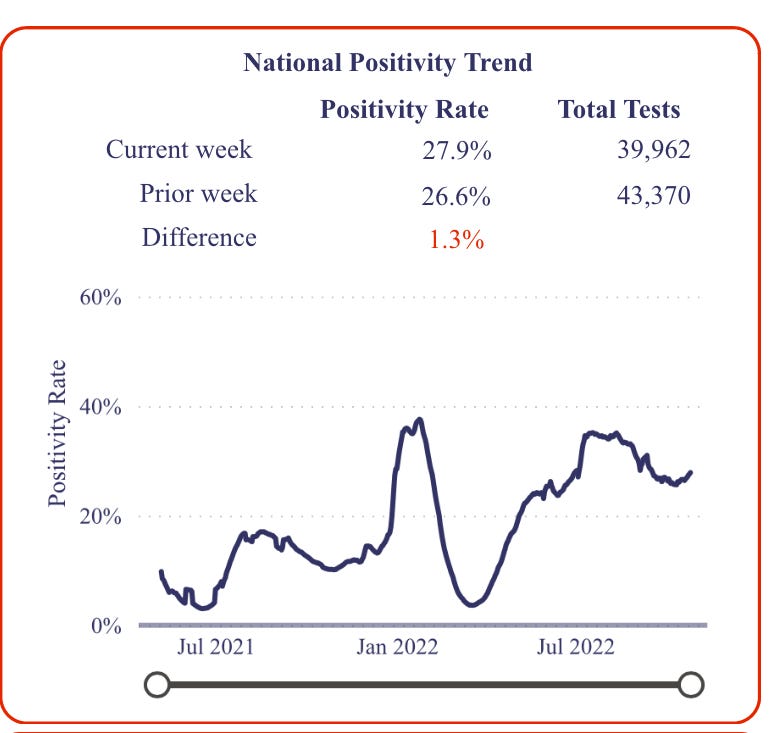
Meanwhile……for week ending 10-26-22, here is the Walgreens covid reporting data. For easy math sake, lets assume 40,000 tests were done that week and if 28% were positive that would be approximately 11,200 positive cases of “covid”.
So why are the pounding the flu data so hard when alleged “covid” cases are much much higher? My other question is if the masses followed the advice of Ashish Jha, and “rolled up both of their sleeves to get omicron in one arm and flu shot in the other because that is why God gave us 2 arms”, then shouldn’t both of those injections be keeping flu and covid numbers low?
Oh yeah thats right. Back to my hypothesis above. We whacked out everyone’s immune systems. I will also hypothesize that the number of “died suddenly” are being absorbed into the flu deaths this winter along with covid deaths. Ethical Skeptic will be tracking this I am sure. Easy to stash those cardiac and cancer deaths under flu and covid as the cause. The CDC is salivating for flu season to get here so badly they started it earlier than normal so they can stash the death data from “died suddenly” somewhere else besides covid.
Buckle up for a crazy winter my friends.


Time to start counting everybody with a tiny bit of flu in them as a flu case, and therefore a flu hospitalization and a flu death! Maybe kick some cash to the hospitals who treat flu patients!
WHAT COULD GO WRONG?
This is great article for anybody who’s got friends & family still asleep. - Ask those people the tough questions- How many news stories do you remember where they said: “We did not identify the flu shot strain correctly- so that’s why the cases are up”
Do you think they would falsely publish a story like this Independent trash in order to promote more shots that equal more dollars for pharma / retail drug stores / primary care?
Have you seen how unsuccessful flu shots have been since the CDC has kept track?