The average deaths per month skyrocketed after early 2020. And it isn’t stopping.

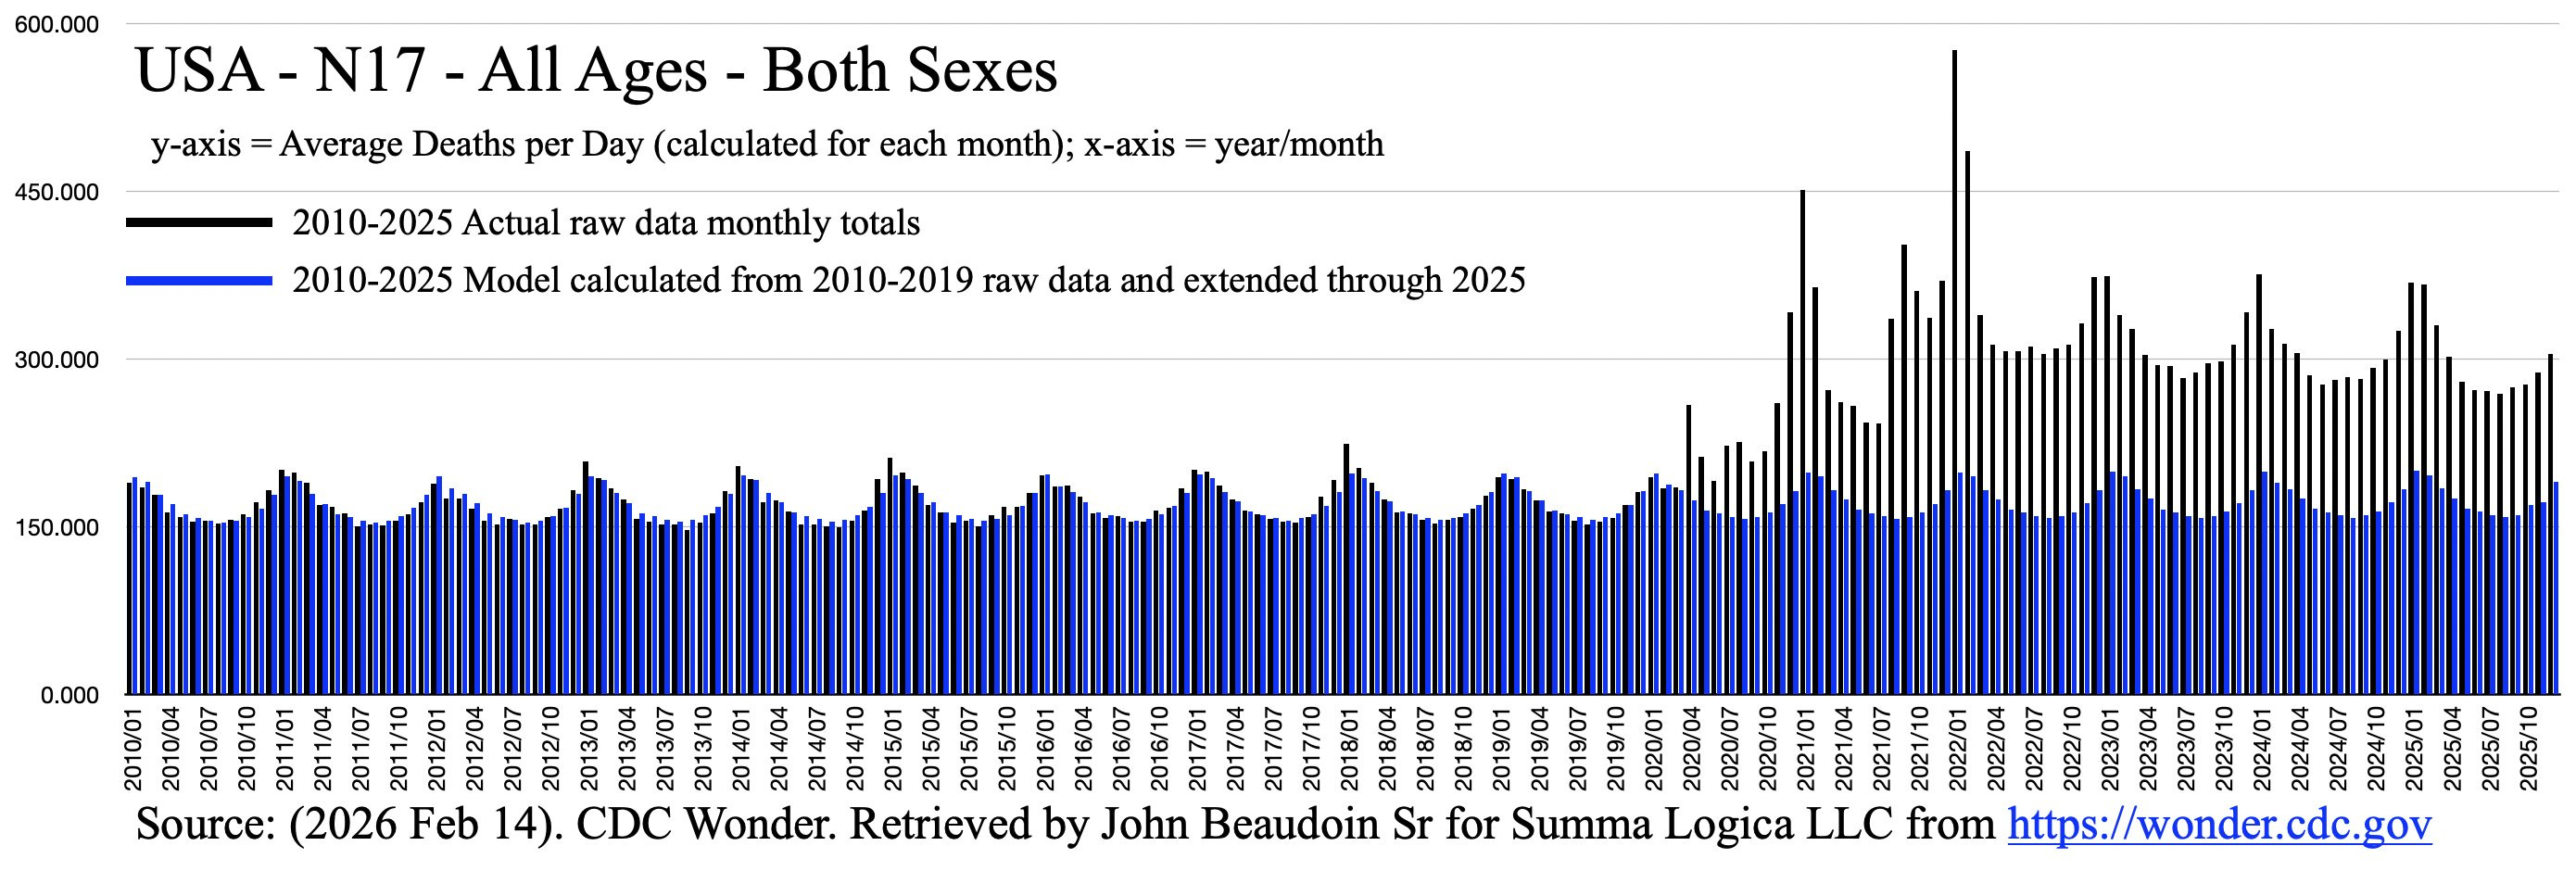
The blue lines are “anticipated predicted death” per day. The black lines are actual deaths. You can see prior to 2020, the prediction versus actual was pretty accurate and within statistical expectancy. But 2020 and beyond?!?! Not even close. You will note the classic excessive peaks around vaccine and booster periods in 2020-2021.
April, 2020, was when Fauci's death protocol was implemented in all hospitals in the US. That's when excess deaths show up on your chart. Prior to that, according to ER nurses, people would come in to the hospital quite ill with covid or some other respiratory illness, they would put them on antibiotics and steroids, they'd get better within 3 or 4 days and go home. After Fauci's ram-a-tub-down-their-throat-and-shoot-them-up-with-poison protocol, most died in the hospital.
Rancourt's analysis concluded there was no pandemic. The excess deaths were due to how much the people were assaulted. In the US it was with tubes and remdesivir. In other countries it was mandatory quarantine by the military. In countries where the population was not assaulted, there were NO excess deaths. Rancourt pointed out that the virus respected political boundaries, as if it needed a passport to go from one country to the next!
It must be a tough time to be an actuarial. Bad time to be a life insurance company. Good time to own a funeral home. Early on during the Jab Hysteria, our neighbor’s son made it home from the shot clinic, parked the car, and then died before he could get out and come in the house. Our neighbors were told there was absolutely NO connection between the COVID jab and his death 1/2 hour later. They still don’t believe that.