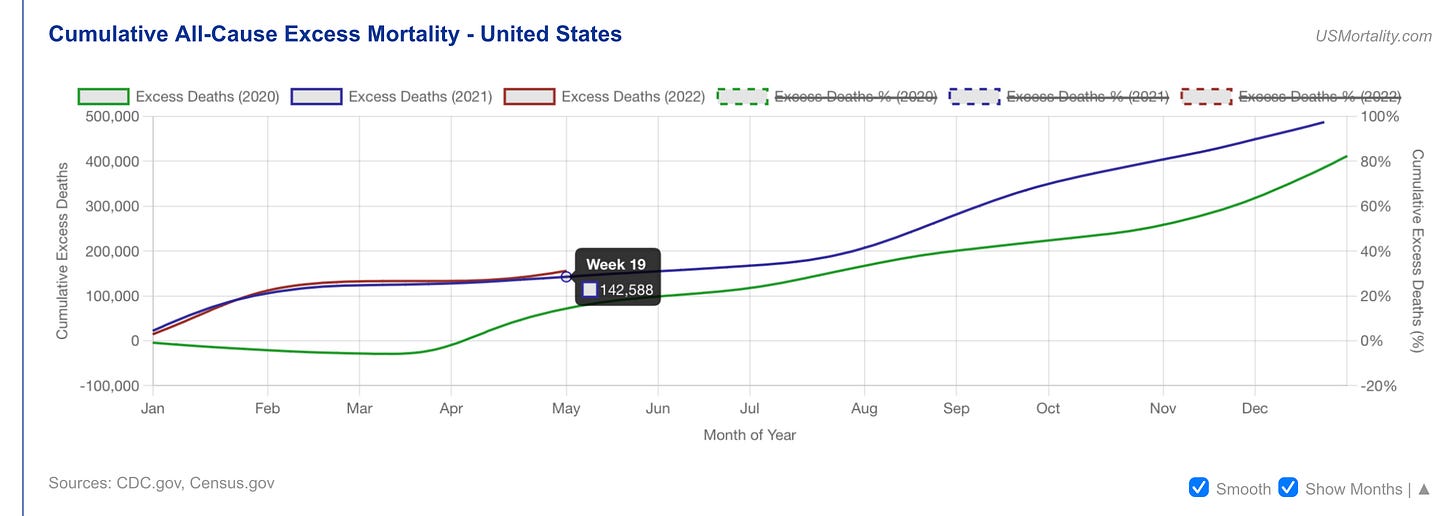
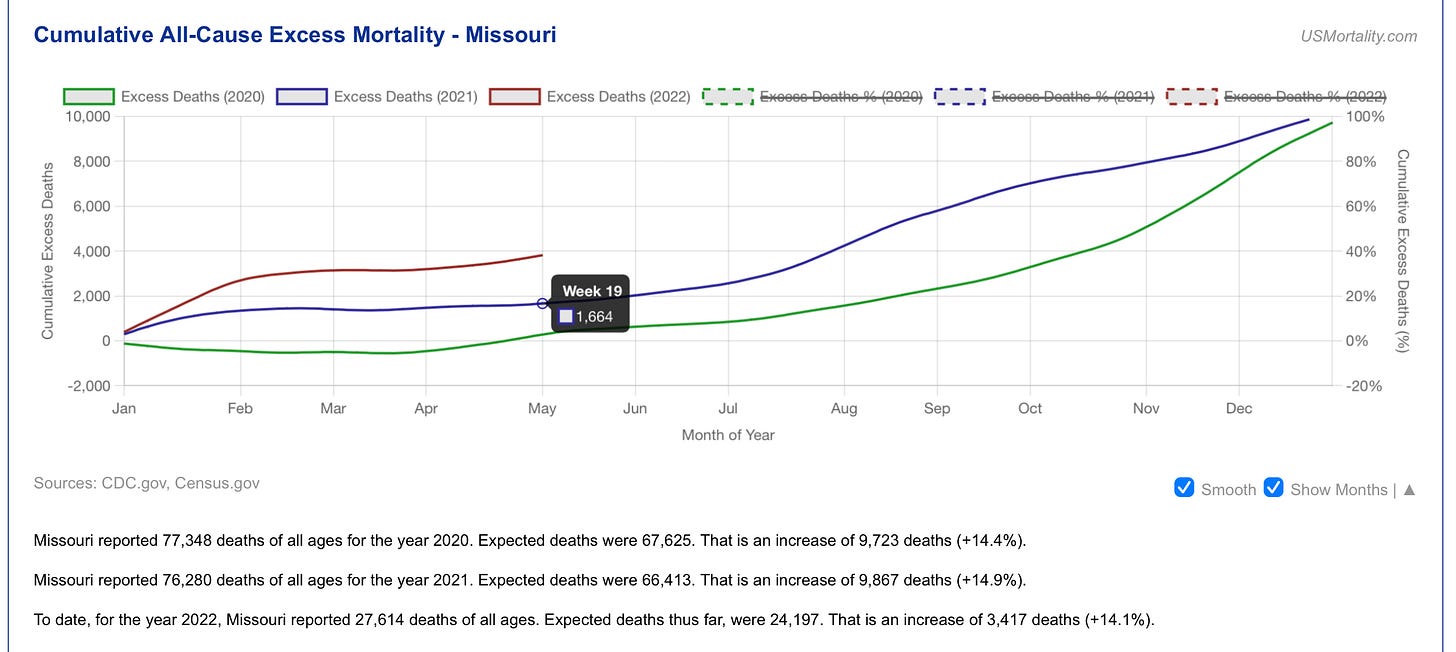
Digging right in. Excess mortality usually has some lag to the data reporting, so we are about a month behind in what we see. We looked at Q1 when March ended…..now we have data into week 19, May 2022. This is all age all cause excess mortality.
As you can see, for all ages, we are up 13% with more than 1 million excess deaths in the United Staes for year 2022.
Here is the breakdown in deaths for week 19 comparing 2022 to 2021.
2021 142,588 deaths on week 19. In excess death territory
2022 155,749 deaths in week 19. Also in excess death territory
So my brain starts to think well why do we have 13,000 MORE deaths this week this year compared to last year? BOTH years were clearly neck and neck in the excess death category.
So I looked at the states that comprise the Kansas City metro area.
Here is the Kansas data. Excess deaths are WAY up this year compared to last year, and week 19 2022 compared to week 19 2021. We had 1,000 MORE deaths on week 19 2022 versus 2021! Why???
Next at bat is Missouri
Again…..we more than DOUBLED deaths on week 19 2022 versus 2021.
Again, I ask why. Week 19 in May is usually a fairly low death period. We are out of winter flu season, entering a statistically more “healthy” time of the year. Winter is always the highest death months. You can visit the excess mortality site and explore through it, but I will say the excess deaths are NOT coming from the elderly. Their numbers of death are below 2021. This is Age 65 and under making up the majority of these deaths.
Feel free to check it out for yourself. https://www.usmortality.com/excess-absolute
** addendum. The CDC did an “overhaul” of their data. They state it was an “Upgrade”. The problem is, 52,000 deaths disappeared from the data. If you go to excess mortality NOW, compared to this screenshot…….you can see the little game they played. Deleted data to cover up the actual excess deaths. Ethical Skeptic is following this story very closely. You can follow him on twitter for the updates.


Hi, Dr. Brown. When were these screenshots taken. I visited the link you provided and clearly you can seen the red line for 2022 now trending under the blue 2021 line. As your first screenshot shows, 2022 was clearly trending above last year.